
By Russell Rhoads,
head of research
The longest week over week S&P 500 losing streak since 1990 is eight weeks which ended on March 23, 2001. With last week’s 6.58% gain, the S&P 500 losing streak came up one week short at seven. I’m pretty sure most of us are happy to see at least a relief rally in the midst of so many weekly losses in a row.
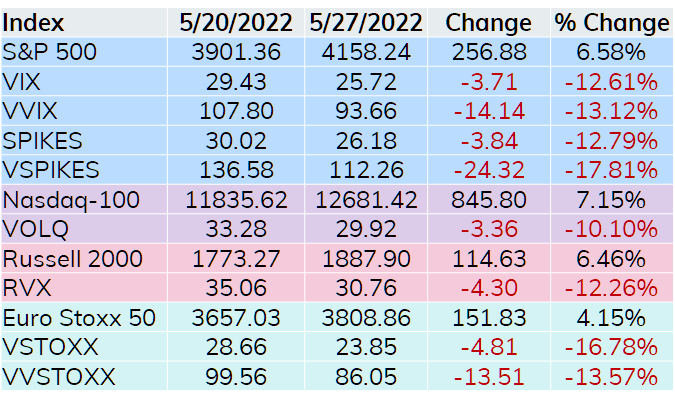
All the broad based indices on the table above put up solid numbers and the respective volatility indices reacted as we would expect by moving lower. Some of this big drop may be attributed to the current three-day weekend, but lower expected volatility is expected to accompany rallies like we saw last week.
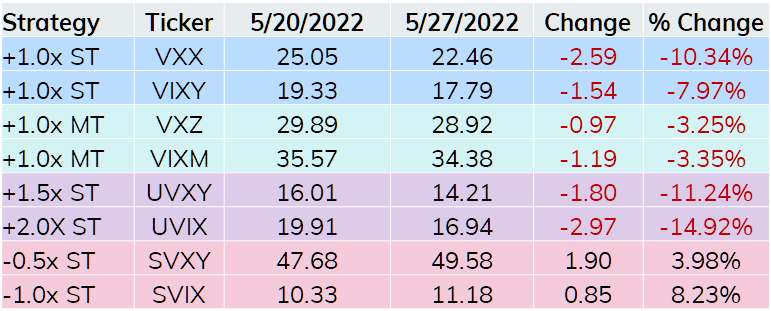
In the volatility ETP space, all funds followed the script with the long funds losing value and short funds rising. Note SVIX, which offers short exposure to the front two monthly VIX futures contracts slightly beat the gains in the S&P 500.
The short end of the VIX curve moved lower and going out to October it is in contango. November through January starts to deviate from the script with November at a discount to October and December below both November and January. The V shape at the end of the curve is normal, All three futures at a discount to October when the rest of the curve is displaying contango is not.
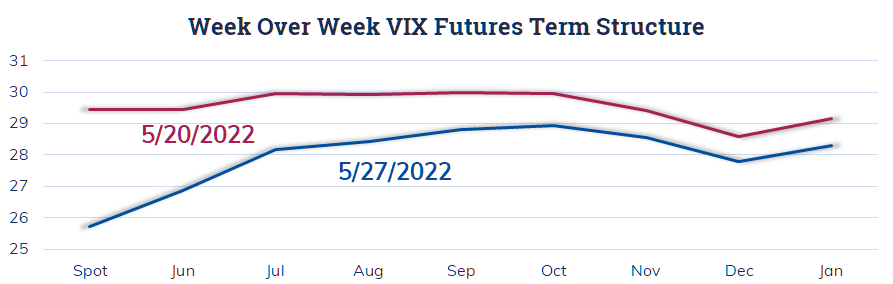
The farther end of the curve has been displaying relative weakness for a while. My assumption has been an expectation that stocks will rally into the end of 2022. This may be based on the hope that inflation is finally under control and the Fed is near the end of raising rates. This differs a bit from the interest rate derivative markets appear to be pricing in consistent rate hikes through the February 2023 meeting and the target rate topping out at 2.75 to 3.00%.
At least one trader is expecting higher volatility over the next couple of months. They expressed this view using UVIX options expiring on July 15. Late Thursday with UVIX trading at 18.28, 1000 UVIX Jul 15th 19 Calls were purchased for 4.60 and the same number of Jul 15th 27 Calls sold for 2.66 resulting in a cost of 1.94 per bull call spread. Checking the tape, this appears to be the largest lot of a position of 3000 spreads.
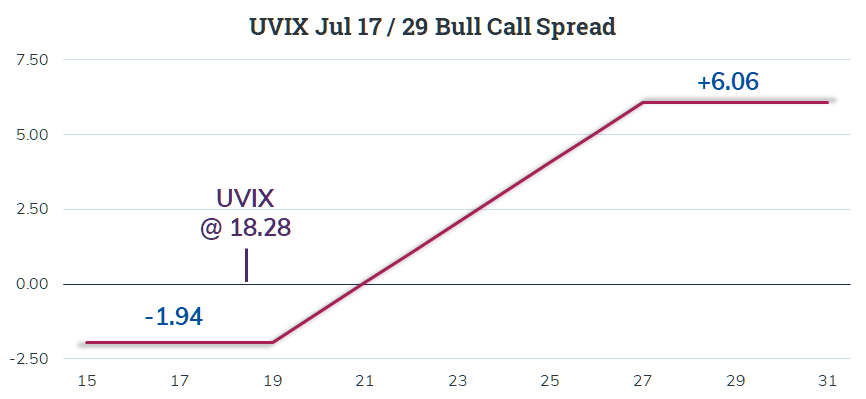
The payoff diagram above is based on holding through July expiration. Typically, a long volatility trade should be monetized due to the mean reverting nature of volatility whenever there is a quick move higher. With UVIX being relatively new, it will be easy to keep an eye on these two contracts and see if there is a managing or profit taking transaction over the next few weeks.
As the markets rallied on Friday a trader focused on NDX took a position using the standard AM-settled June 17 options. With NDX at 12573 someone sold 800 NDX Jun 17th 13475 Calls for 57.70 and purchased 800 NDX Jun 17th 13500 Calls for 54.20 resulting in a credit of 3.50.
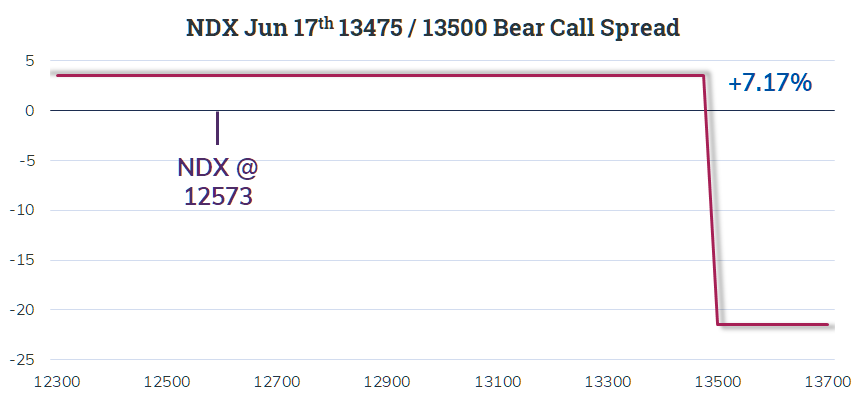
The buffer for this trade is a rise of 7.17% over the next three weeks. On first glance this is a big move in a short period of time. However, if you scroll back to the first table in this piece you can see NDX can put up numbers like that in just a week.