
By Russell Rhoads,
head of research
Enjoying the Saturday Review? After August 1 it will become a part of our EQD+ bundle. Subscribe today for continued access: http://armanios.co.uk/dev/eqd/become-a-member
In the U.S., last week stocks lost ground and volatility indices were mostly lower as well. This usually gets market observers all fired up. However, this has been a frequent occurrence in 2022 so we do not read too much into this divergence. Also, it happened during a week approaching a three day weekend which usually has a dampening effect on volatility indices.
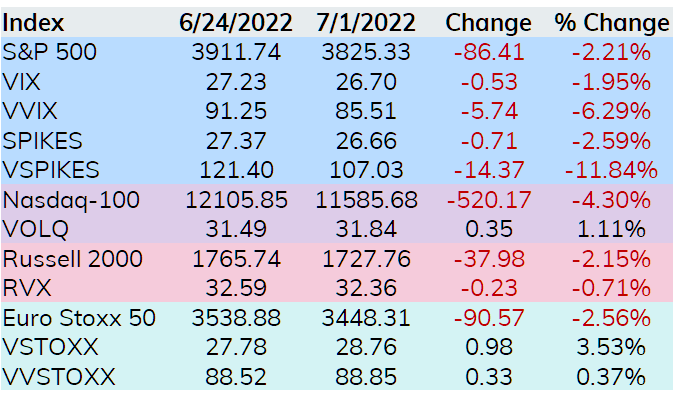
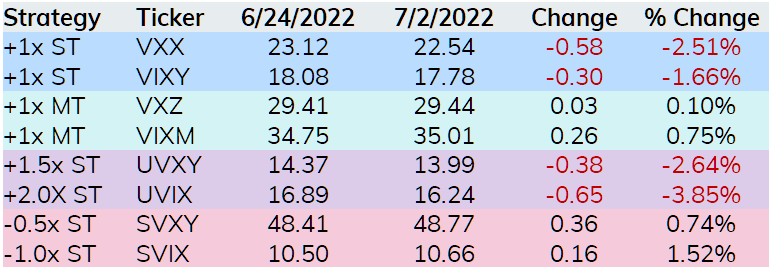
The VIX related ETPs were also mixed with the short dated long ETPs that focus on the front two month VIX futures (VXX, VIXY, UVXY, and UVIX) all losing value. The two long funds that focus on longer dated futures rose a bit as did the short dated short VIX ETPs.
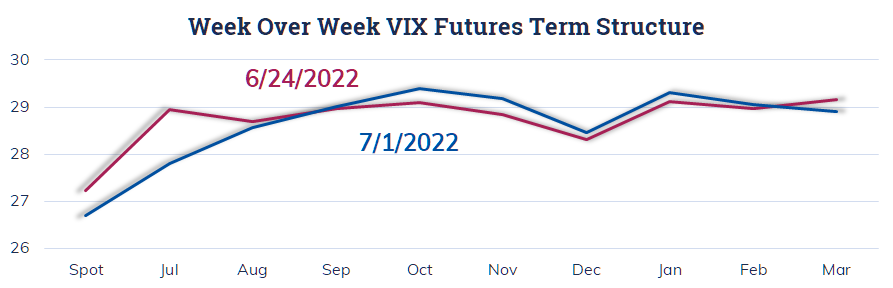
The VIX curve shows why the longer dated long funds were higher last week. The short dated futures dropped, along with VIX, while the October through December contracts moved higher. As a reminder the longer dated VIX ETPs offer exposure to the 4th through 7th month futures.
There has been much talk about the first half of 2022 being the worst first half for stocks in decades. This is based on the S&P 500 losing more than 20%. We decided to take things a bit further and look at average VIX over the first half of years going back to 1990 and the subsequent SPX and VIX performance in the second half.
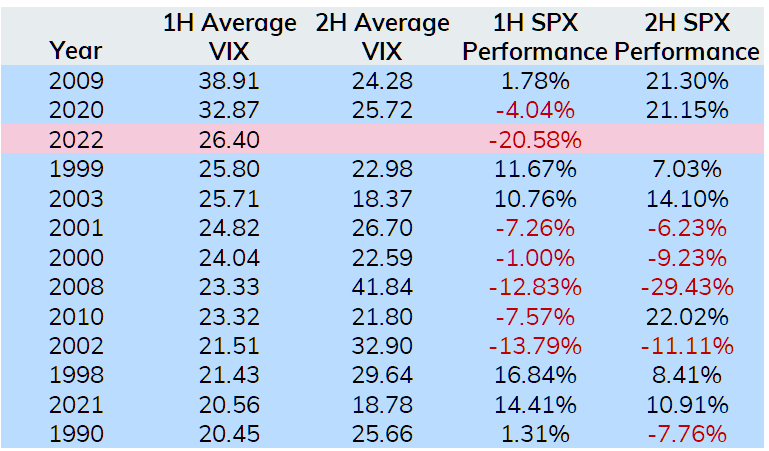
There is a lot to digest in the table above, but two things stand out to us. First, VIX tends to remain elevated in the second half of the year relative to the long term history for VIX when VIX averages over 20 in the first half. Second, if VIX is elevated and the S&P 500 loses value during the first half, there is a good chance stocks will lose ground in the second half. However, the two times this did not hold up, SPX gained over 20% in the second half (2010 and 2020). Based on those two outlier years I would definitely have risk control in place if short stocks for the second half of 2022.
As the trading day ended on Thursday, one trader initiated a long dated NDX bull call spread looking for NDX to be over 11700 in early 2023. With NDX at 11504 this trader purchased the NDX Jan 2023 11400 Call for 1162.46 and sold the NDX Jan 2023 11700 Call for 997.04 resulting in a net cost of 165.42.
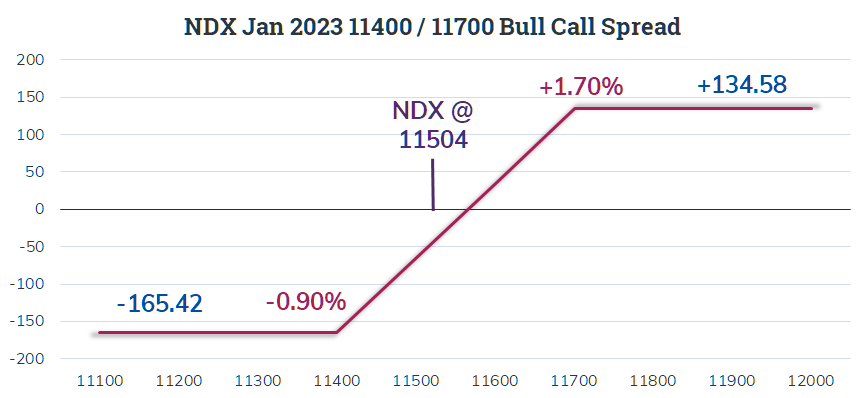
The outcome at expiration involves a maximum profit of 134.58 if NDX rises 1.7% or more during the second half of 2022. A drop of 0.9% or more would result in a loss equal to the cost of the spread.
Another interesting bullish trade popped up late Friday in the SPX arena with the index at 3822. This trade has a much shorter time horizon than the NDX trade discussed above. With minutes to go in the trading day there was a buyer of the SPX Jul 15 3800 Calls for 85.50 who sold the same number of SPX Jul 15 3850 Calls for 58.40 resulting in a cost of 27.10. The payout in a couple of weeks, at expiration, shows up below.
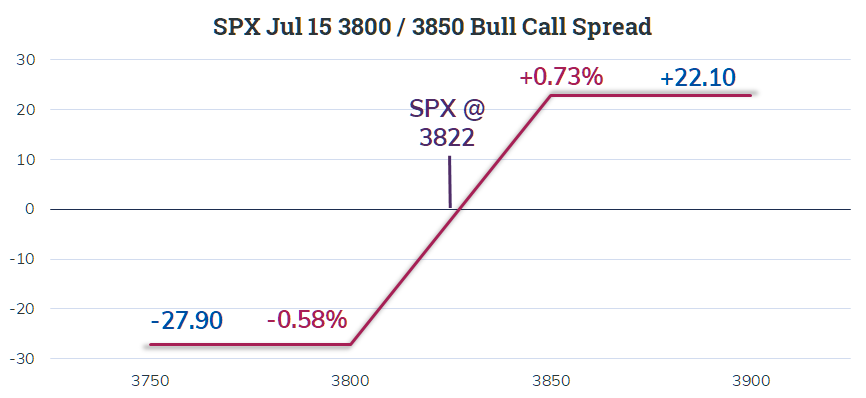
I find this trade interesting as it expires at the end of the beginning of second quarter earnings season. Typically, I look to NDX around earnings for trades focusing on earnings season, but in the days before expiration many large banks and early reporters will share results and their outlook for the balance of 2022. My assumption is the trader behind this is focusing on the market reaction to earnings and expects them to be a net positive for the equity market.