
By Russell Rhoads,
head of research
Enjoying the Saturday Review? After August 1 it will become a part of our EQD+ bundle. Subscribe today for continued access: http://armanios.co.uk/dev/eqd/become-a-member
U.S. stocks had a nice holiday shortened week with the Nasdaq-100 (NDX) leading the way gaining 4.66%, more than twice the performance from the S&P 500 (SPX) and a tad more than 2% better than the Russell 2000 (RUT). The respective volatility indices were all lower as well with VIX settling below 25 and VOLQ finishing below 30 for the first time in almost a month.
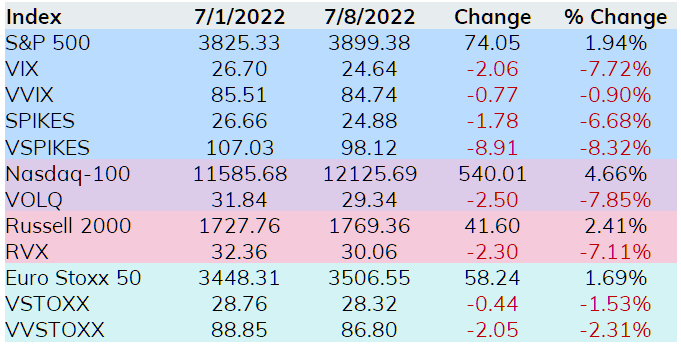
Before moving to the VIX related ETPs, we dug into performance from the big three US equity indices and noted that NDX is slowly closing the gap with SPX. At the worst point this year NDX was down 31.8% for the year, while SPX’s lowest point was a loss of 23.1%. The SPX is now 6.34% off the lows, while NDX has bounced 8.97% off the 2022 lows.
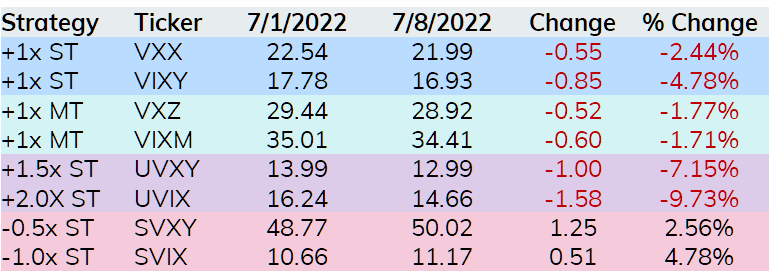
In the VIX ETP space, the long funds all took it on the chin with VIX and the front month futures coming under pressure. The short funds had a nice week with SVIX leading the way, rising almost 5%.
On Wednesday last week the call / put ratio for VIX option trading finished the day over 5.00 for the fourth time this year. This means five or more VIX calls traded for everyone VIX put during the trading session. It is typical for more calls than puts to trade on most days in the VIX arena and for context the average VIX call / put ratio in 2022 has been about 1.75.
Wednesday’s figure prompted an article discussing how this is bullish for VIX and bearish for stocks. We decided to dig a bit on Wednesday’s VIX option trading to explore the trading action to determine if the elevated VIX call / put ratio was an indication of a bullish outlook for VIX. It was not.
The first reason this should not be taken as a bearish equity market signal is the trade that contributed to such a high level for the call / put ratio. About 40% of the volume on Wednesday was a transaction rolling a very large October 1 x 5 call spread out to March of 2023. The second reason we came to this conclusion is the level of VVIX. The chart below shows each instance where the VIX call / put ratio finished the day over 5.00 along with the closing level for VVIX.
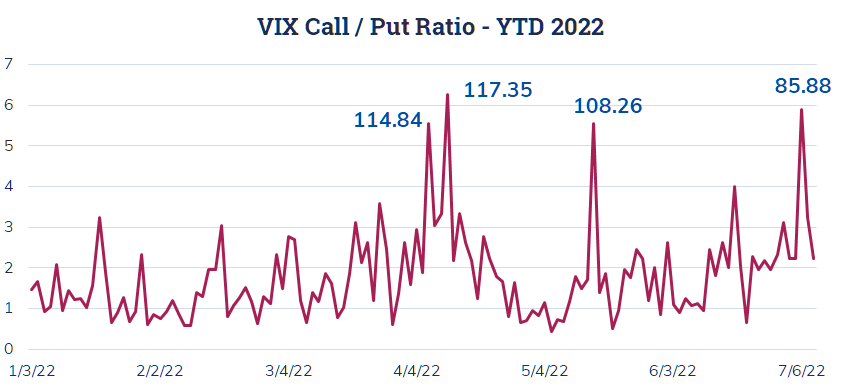
The rolling transaction that contributed to the high VIX call volume on Wednesday would not impact VVIX as it measures 30-day expected volatility for VIX. However, VVIX is near 2022 lows and well under 100, a level that many traders focus on. The point here, don’t follow a single number for a bullish or bearish outlook without doing a little digging first.
Late Friday, one trader turned to Nasdaq-100 Micro Index (XND) options to protect a portfolio against a drop this coming week in the form of a collar. With XND, which is quoted at 1/100 of NDX, at 121.18 a trader sold 100 XND Jul 15 123 Calls for 1.01 and used that credit to buy 100 XND Jul 15 119 Puts for 1.01. This results in a costless collar and a payoff that appears below.
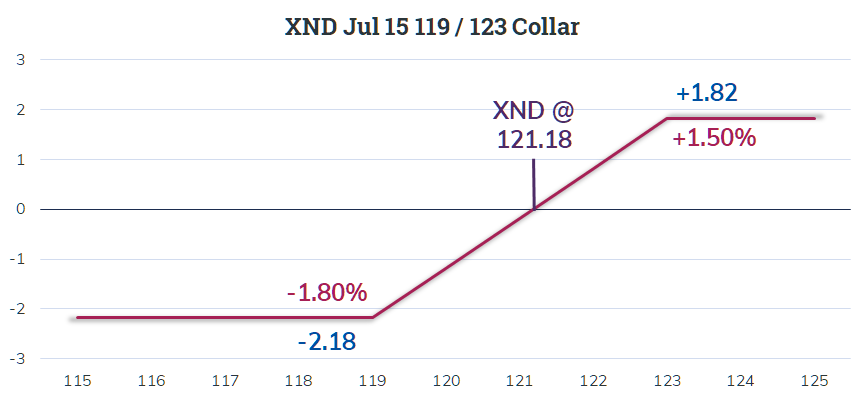
These two option positions combined with a long Nasdaq-100 portfolio gives up any gains next week over +1.50% and limits any losses greater than -1.80%.
Another trade that is of interest uses options on the upstart SVIX ETP. SVIX offers short exposure to the front two monthly VIX futures contracts. With SVIX at 11.25 a trader sold 100 SVIX Jun 2023 8 Puts for 1.77 and purchased 100 SVIX Jul 2023 2 Puts for 0.17 each netting a credit of 1.60.
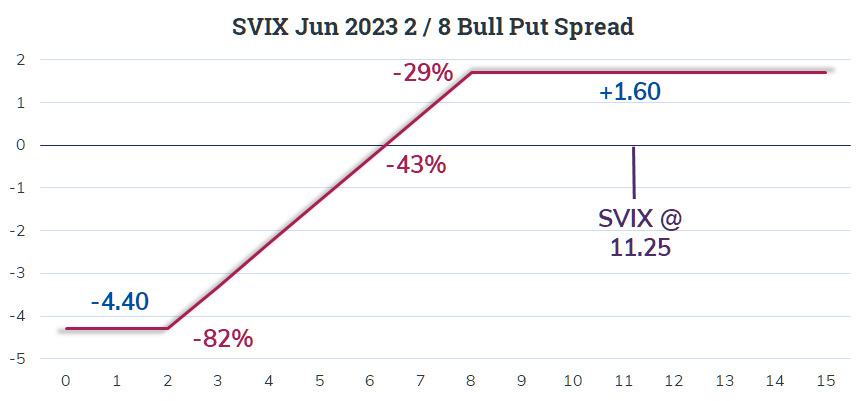
This trade uses options expiring in just over 11 months and the as long as SVIX is not below 8.00 the outcome is a profit equal to the credit received when the trade was put on. Breakeven would require a drop of 43% and the maximum loss occurs if SVIX drops 82% or more. All of these scenarios are possible but a repeat of 2018’s volmageddon event is likely the biggest risk to this trade.