
By Russell Rhoads,
head of research
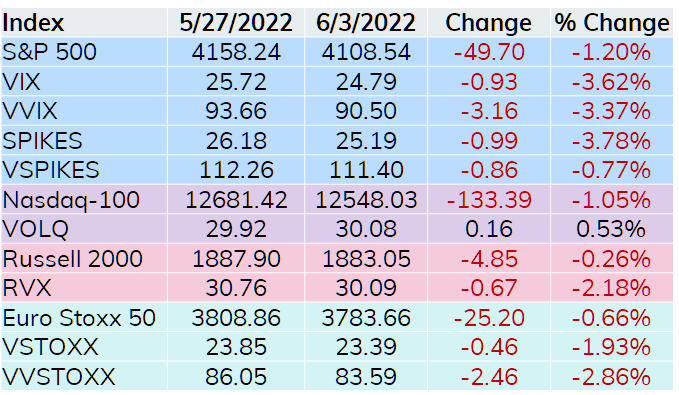
Friday’s price action pushed the major U.S. indices lower on the week, but a relative quiet week also resulted in all but one volatility index moving lower. The outlier below is VOLQ, which rose slightly, possibly due to excess volatility and future uncertainty in larger Nasdaq-100 components (I’m looking at you Elon Musk).
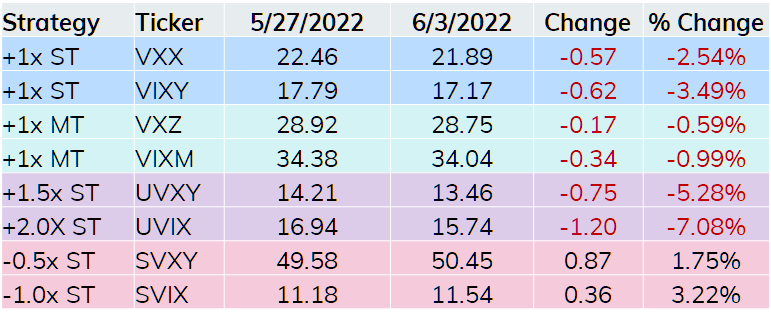
In the VIX related ETF space, the long funds gave back some of the recent performance and the two short funds managed to gain a bit. The upstart SVIX was the weekly winner gaining over 3%.
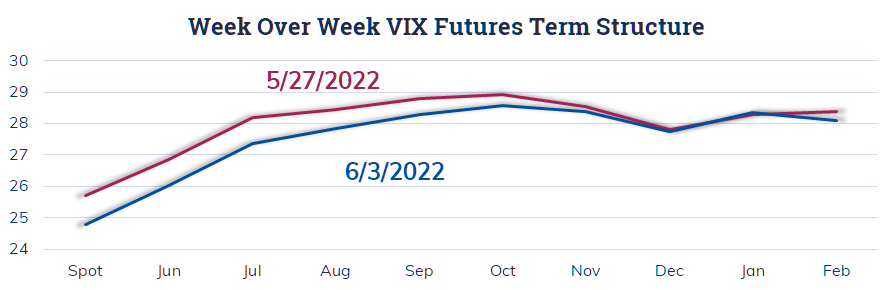
Finally, the shorter end of the VIX curve moved lower with VIX dropping a bit along with the passage of time putting a little pressure on the June and July contracts. The unusual shape farther out on the curve (November to February) continues to have me thinking the mind of the market expects a strong fourth quarter or at least lower volatility to finish out 2022.
Turning to one of the most actively traded index option markets in the world, there was a ‘fat finger’ trade that is being looked into involving Nifty 50 (NIFTY) options. This past week someone entered an order to sell 25,000 NIFTY Jun 2 14500 Calls at the market. NIFTY was around 16600, meaning they were 2100 points in the money at the time of this ‘punch error’ (a phrase I am taking from an article in India and really like). The chart below shows the offer side for this contract every 10 seconds over a 10-minute period.
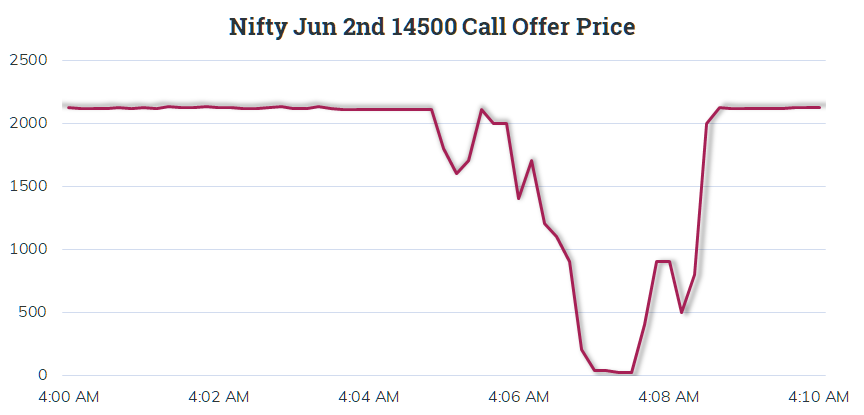
The time zone is Chicago but this trade did happen during regular market hours at the National Stock Exchange (NSE). Some sales were as low as 0.20 for options that were over 2100 points in the money at the time. Finally, the trader bought back the calls back (at higher prices) as expiration was looming leaving them with no viable alternative other than a very nasty settlment.
Finally, I believe I have come across a collar using Nasdaq-100 Micro Index (XND) options that was opened on Tuesday last week using June 3 options and then rolled out to June 10 options on Friday. With several moving parts, I think bullet points may be a better way to talk about this trade.
Tuesday May 31 – XND @ 125.23
- Buy 100 XND Jun 3 122 Puts at 0.81 / Sell 100 XND Jun 3 128 Calls at 0.81 – Net 0.00
Friday Jun 3 – XND @ 126.06
- Sell 100 XND Jun 3 122 Puts at 0.10 / Buy 100 XND Jun 3 128 Calls at 0.10 – Exit 0.00
Friday June 3 – XND @ 125.34
- Buy 100 XND Jun 10 122 Puts at 1.00 / Sell 100 XND Jun 10 128 Calls at 1.00 – Net 0.00
The payoff this coming Friday for the June 10 trade appears below.
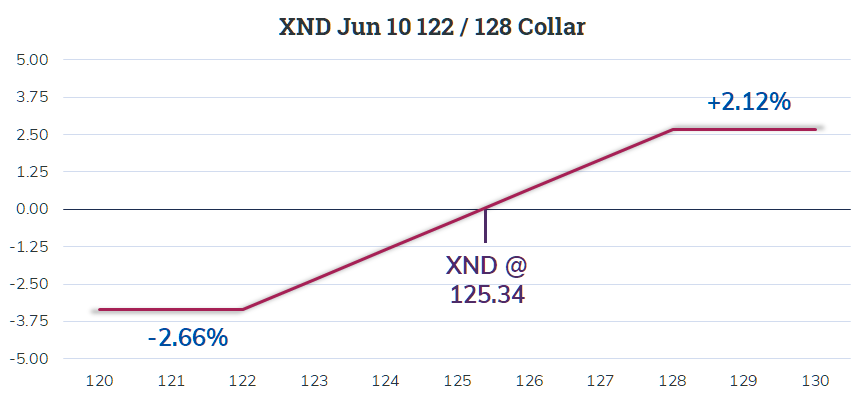
Note this trade guards against a loss greater than 2.66%, but gives up gains in excess of 2.12%. The collar is ‘costless’ on a premium basis, but still has a cost in the form of giving up some upside. Also, the trade using June 10 options occurred about an hour later than the exit trade for the first collar.
One might ask why use XND when the same coverage could have been achieved using one NDX option. My best guess is either having the ability to allocate this hedge to smaller accounts or the ability to scale in and out of this position is the motivation behind turning to XND.
Along the same topic, I participated in a webcast for Interactive Brokers discussing the difference between broad based ETF and different size index options. One of the questions I received during that webcast asked why a trader would use smaller contracts. My response was what I just wrote in the previous. The full recording may be accessed using the link below
https://ibkrwebinars.com/webinars/choosing-between-etf-and-index-options/